Introduction
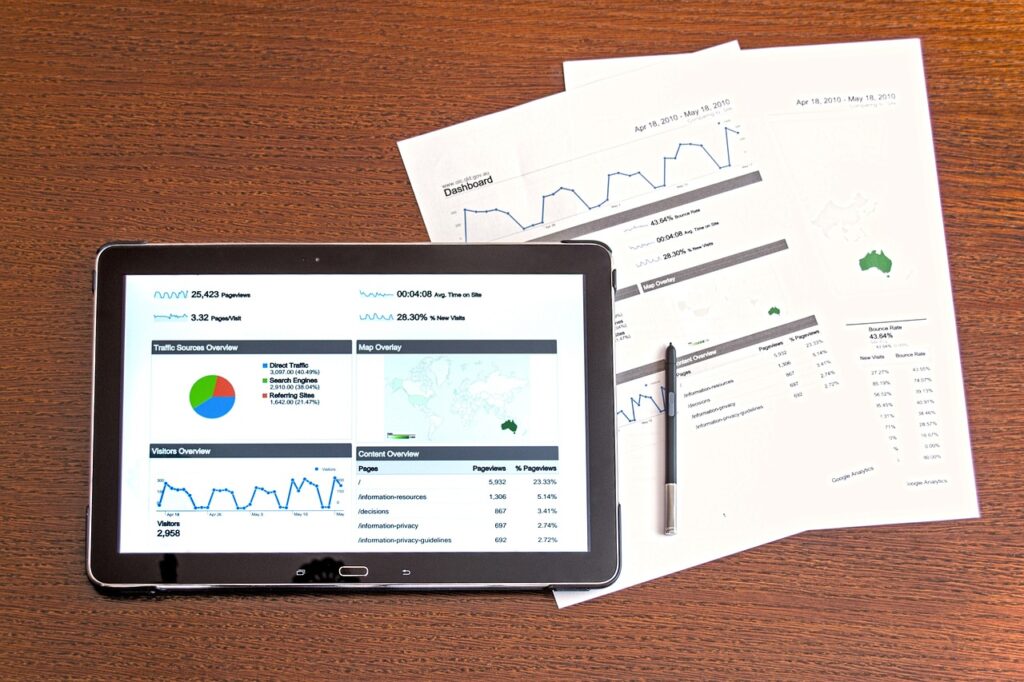
It is the age of data nowadays, and thousands of terabytes of data are produced by businesses daily. Raw data can only take you so far if you don’t know how to interpret it. That is the point where Business Intelligence (BI) and Data Visualization come into play. Data visualization involves the representation of various data sets in a graphical form, which works perfectly well when you need to show trends, patterns, and predictions of data.

What is data visualization in business intelligence?
Data visualization is the process of converting raw data into graphical or pictorial representations such as charts, graphs, and dashboards. It helps businesses to:
- Identify trends that may not be evident in spreadsheets or reports.
- Make data-driven decisions faster and more accurately.
- Communicate insights effectively across teams.
- Improve operational efficiency by uncovering inefficiencies.
By leveraging BI tools, companies can analyze and visualize data in real-time, leading to more strategic and informed business decisions.

Why is Data Visualization Important in BI?
1. Enhances Data Interpretation
It isn’t easy to make sense of numbers and raw data. The use of visualizations also allows you to simplify your datasets, exploring the data quickly and identifying the most important insights.
2. Facilitates Faster Decision-Making
With interactive dashboards and real-time reporting, businesses can quickly react to market trends, customer behaviors, and operational challenges.
3. Identifies Hidden Patterns and Trends
Visualization tools highlight patterns in data that might go unnoticed in traditional reporting. This is crucial for:
- Spotting market trends before competitors.
- Analyzing customer preferences and behaviors.
- Tracking operational performance across departments.
4. Improves Communication Across Teams
Visual reporting can provide an advantage for various groups within an organization, like marketing, sales, and finance. Visualizations that are designed well make it easier for non-technical users to comprehend insights and correspond with technical users.
5. Reduces Errors and Enhances Accuracy
This raw data can be misinterpreted if not analyzed correctly. Since all of that information can be abstract, having a data visualization minimizes error.
Types of Data Visualization in BI Tools
Based on the type of data and business needs, different BI tools offer various types of visualizations. The most popular of these are:
1. Bar Chart
Used to compare categories or track trends over time.
2. Line Graph
Ideal for analyzing trends over time, such as revenue growth.
3. Pie Chart
Shows proportions and percentages in a dataset.
4. Heat Map
Represents data intensity using color variations.
5. Scatter Plot
Helps identify relationships and correlations between variables.
6. Geospatial Maps
Used for location-based analysis, such as regional sales performance.
7. Gantt Chart
Commonly used in project management to track timelines and progress.
How to Extract Business Insights Using Data Visualization
1. Understand Key Performance Indicators (KPIs)
Identify the KPIs most relevant to your business and track them using BI dashboards. For example:
- Sales trends
- Customer acquisition costs
- Website traffic analysis
2. Use Real-Time Data for Instant Insights
BI tools provide real-time analytics, allowing businesses to make data-driven decisions on the go.
3. Customize Dashboards for Different Departments
Each department has unique data needs. Custom dashboards help teams focus on metrics relevant to their goals.
4. Drill Down into Data for Deeper Analysis
Start with high-level insights and drill down into specific data points to uncover more detailed trends.
5. Use Predictive Analytics for Future Planning
Many BI tools integrate AI-powered predictive analytics, allowing businesses to forecast trends and make proactive decisions.
Best Data Visualization Tools for BI
Choosing the right BI tool depends on your business needs and level of expertise. Here are some of the best tools for data visualization:
1. Tableau
A leading BI tool with advanced visualization features, ideal for in-depth data analysis.
2. Power BI
Microsoft’s BI tool offers seamless integration with Excel and other Microsoft applications.
3. Google Data Studio
A free tool that provides interactive dashboards and reports, great for digital marketing analytics.
4. Looker
A cloud-based BI tool designed for big data analytics and real-time insights.
5. Domo
An all-in-one business intelligence platform that offers powerful data visualization and automation.
Real-World Use Cases of Data Visualization in BI
1. Retail Industry
Retailers use BI tools to track sales performance, inventory levels, and customer preferences in real time.
2. E-commerce Businesses
E-commerce companies analyze data to optimize conversion rates, website traffic, and customer engagement.
3. Healthcare Sector
Hospitals use data visualization to monitor patient records, resource allocation, and medical research trends.
4. Financial Services
Banks and financial institutions use BI for fraud detection, risk assessment, and investment analysis.
5. Supply Chain and Logistics
Companies analyze shipment tracking, demand forecasting, and warehouse management to improve efficiency.

Getting Started with BI Tools
Implementing a BI tool in your business is easier than ever. Here’s how you can get started:
- Identify Your Business Goals: Determine what insights you need.
- Choose the Right BI Tool: Select a tool based on your requirements and budget.
- Import and Clean Your Data: Ensure data accuracy before visualization.
- Build Custom Dashboards: Design dashboards tailored to different departments.
- Train Your Team: Educate employees on how to interpret visual insights.
Conclusion
Data visualization in Business Intelligence (BI) is a game-changer for organizations looking to leverage data for strategic decision-making. By using the right visualization tools, businesses can enhance data interpretation, speed up decision-making, identify trends, and improve collaboration across teams.
To maximize the benefits of data visualization, companies should invest in user-friendly BI tools, set clear KPIs, and train employees to utilize data-driven insights effectively. By doing so, they can gain a competitive advantage in today’s fast-paced business landscape.
